.jpg)



Taxis, minicabs and Uber account for 24% of airport journeys as new CAA figures reveal major differences between airports

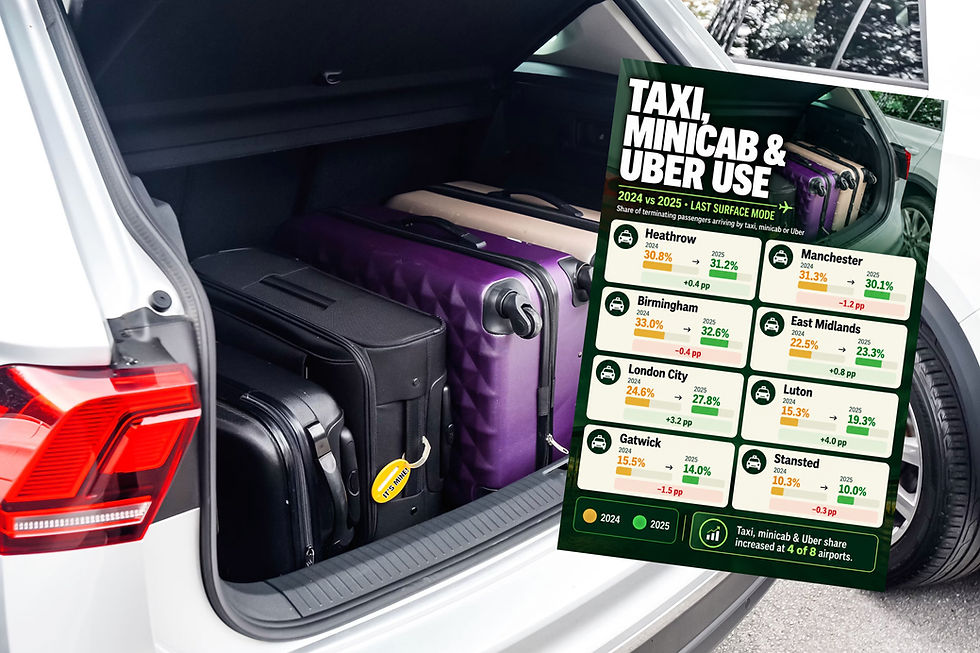

Taxis, minicabs and Uber accounted for 24% of passenger journeys to eight major English airports in 2025, according to newly published figures from the UK Civil Aviation Authority (CAA).
The regulator released its annual departing passenger survey, drawing on approximately 175,000 interviews conducted at airports handling a combined 225 million passengers last year. The results provide a detailed picture of how passengers reach airport terminals and the continuing importance of taxi and private hire services.

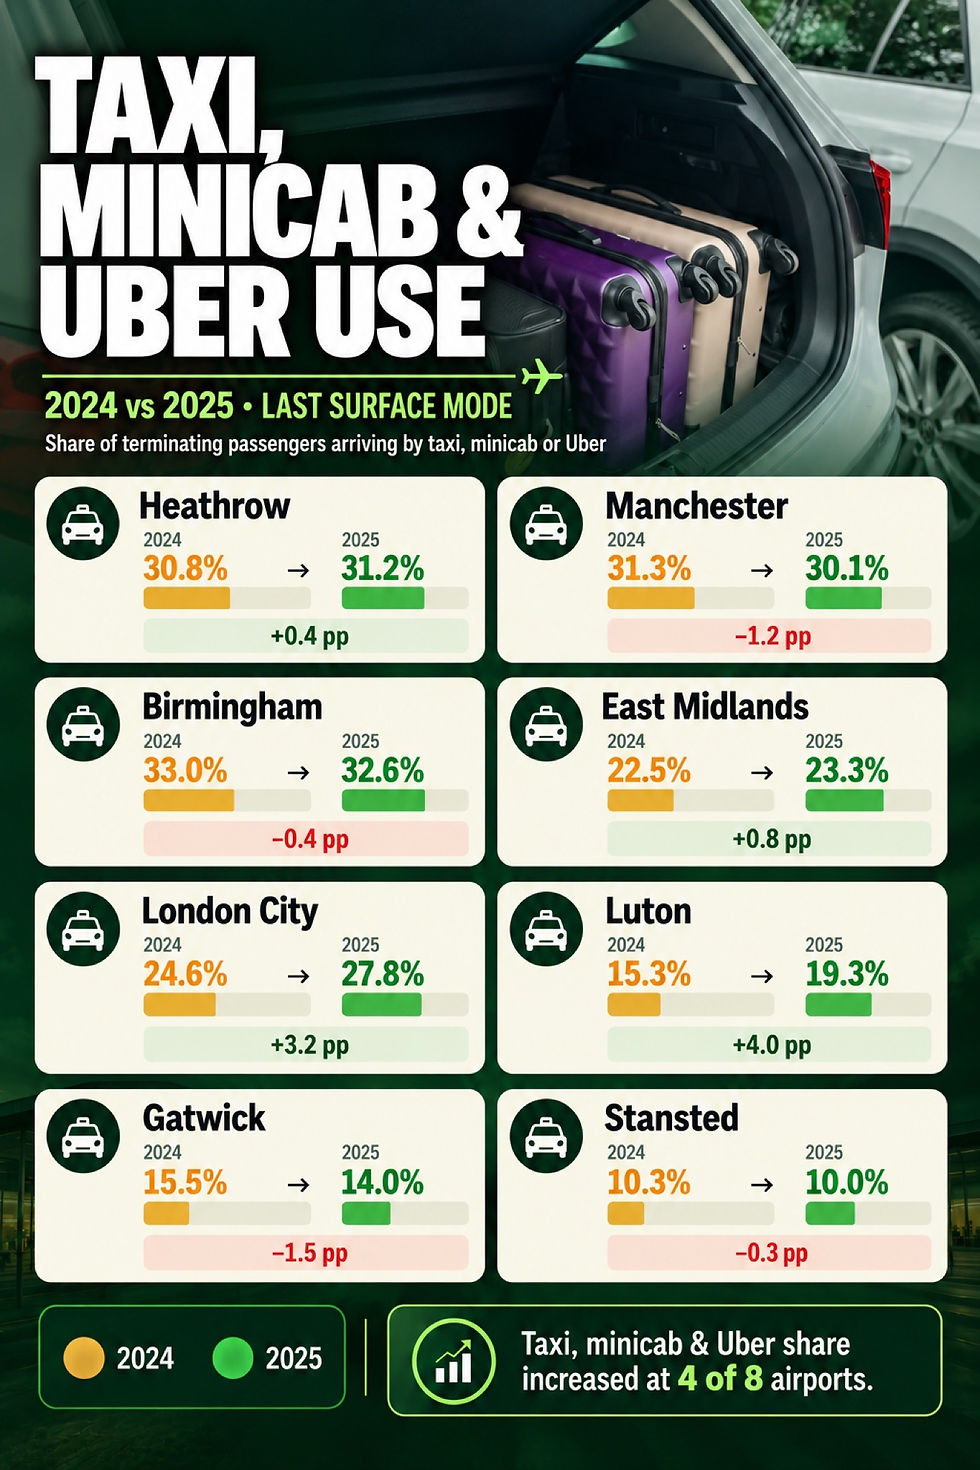
The CAA’s detailed surface-access tables show Birmingham Airport recorded the highest proportion of passengers arriving by taxi, minicab or Uber, at 32.6%. Heathrow Airport followed at 31.2%, while Manchester Airport recorded 30.1%.
London City Airport recorded a 27.8% share, followed by East Midlands Airport at 23.3%, Luton at 19.3%, Gatwick at 14% and Stansted at 10%. The figures measure the final surface transport mode used to reach the airport and combine conventional taxis, minicabs and app-based ride-hailing services into one category.
The largest year-on-year increase occurred at London Luton Airport, where the taxi, minicab and Uber share rose from 15.3% in 2024 to 19.3% in 2025. The four-percentage-point increase came alongside a reduction in the proportion of passengers arriving by private car, which fell from 54.1% to 45.6%.
London City Airport also recorded a substantial increase in taxi and private hire use, rising from 24.6% to 27.8%. Heathrow’s share increased more modestly, from 30.8% to 31.2%, while East Midlands Airport rose from 22.5% to 23.3%.
The picture was different at several other airports. Manchester’s taxi, minicab and Uber share declined from 31.3% to 30.1%, while Gatwick fell from 15.5% to 14%. Birmingham declined slightly from 33% to 32.6%, although it retained the highest proportion among the airports surveyed.
The CAA’s broader findings show public transport use increased by one percentage point to 38% across the surveyed airports. Private transport, including private cars and taxis, accounted for the remaining 62%. London City recorded the highest public transport share at 66%, followed by Stansted at 48%.
For airport transfer operators, the figures indicate substantial differences between individual markets. At Birmingham and Heathrow, approximately one in three passengers arriving at the terminal used a taxi, minicab or Uber, compared with around one in ten at Stansted.
Those differences have potential implications for fleet deployment, airport booking arrangements and investment in dedicated transfer services.
However, the figures do not distinguish between traditional taxis, pre-booked private hire vehicles and individual ride-hailing platforms, meaning they cannot establish the market share of any particular operator.
The data also measures passengers rather than individual vehicle bookings. A taxi carrying several passengers may account for multiple passenger journeys in the survey, so the percentages should not be converted directly into vehicle movements or operator revenue.
The CAA said its survey responses were weighted using actual departing passenger numbers. Its methodology covers passengers interviewed before boarding flights and includes questions about their journey to the airport, travel purpose and other characteristics.
For taxi and private hire businesses, the newly released figures provide an updated benchmark for assessing airport transfer markets. They show that taxis and minicabs remain an important access mode at several major airports, even as the overall proportion of passengers using public transport continues to increase.